
Long Island Property Taxes 2026: The Complete Town-by-Town Guide (Nassau & Suffolk)
Real full-value tax rates for 232 Long Island communities — Nassau and Suffolk, every school district, plus how to read your bill and how to fight it. Rates from the New York State Comptroller (2025); home values from Zillow (2026).
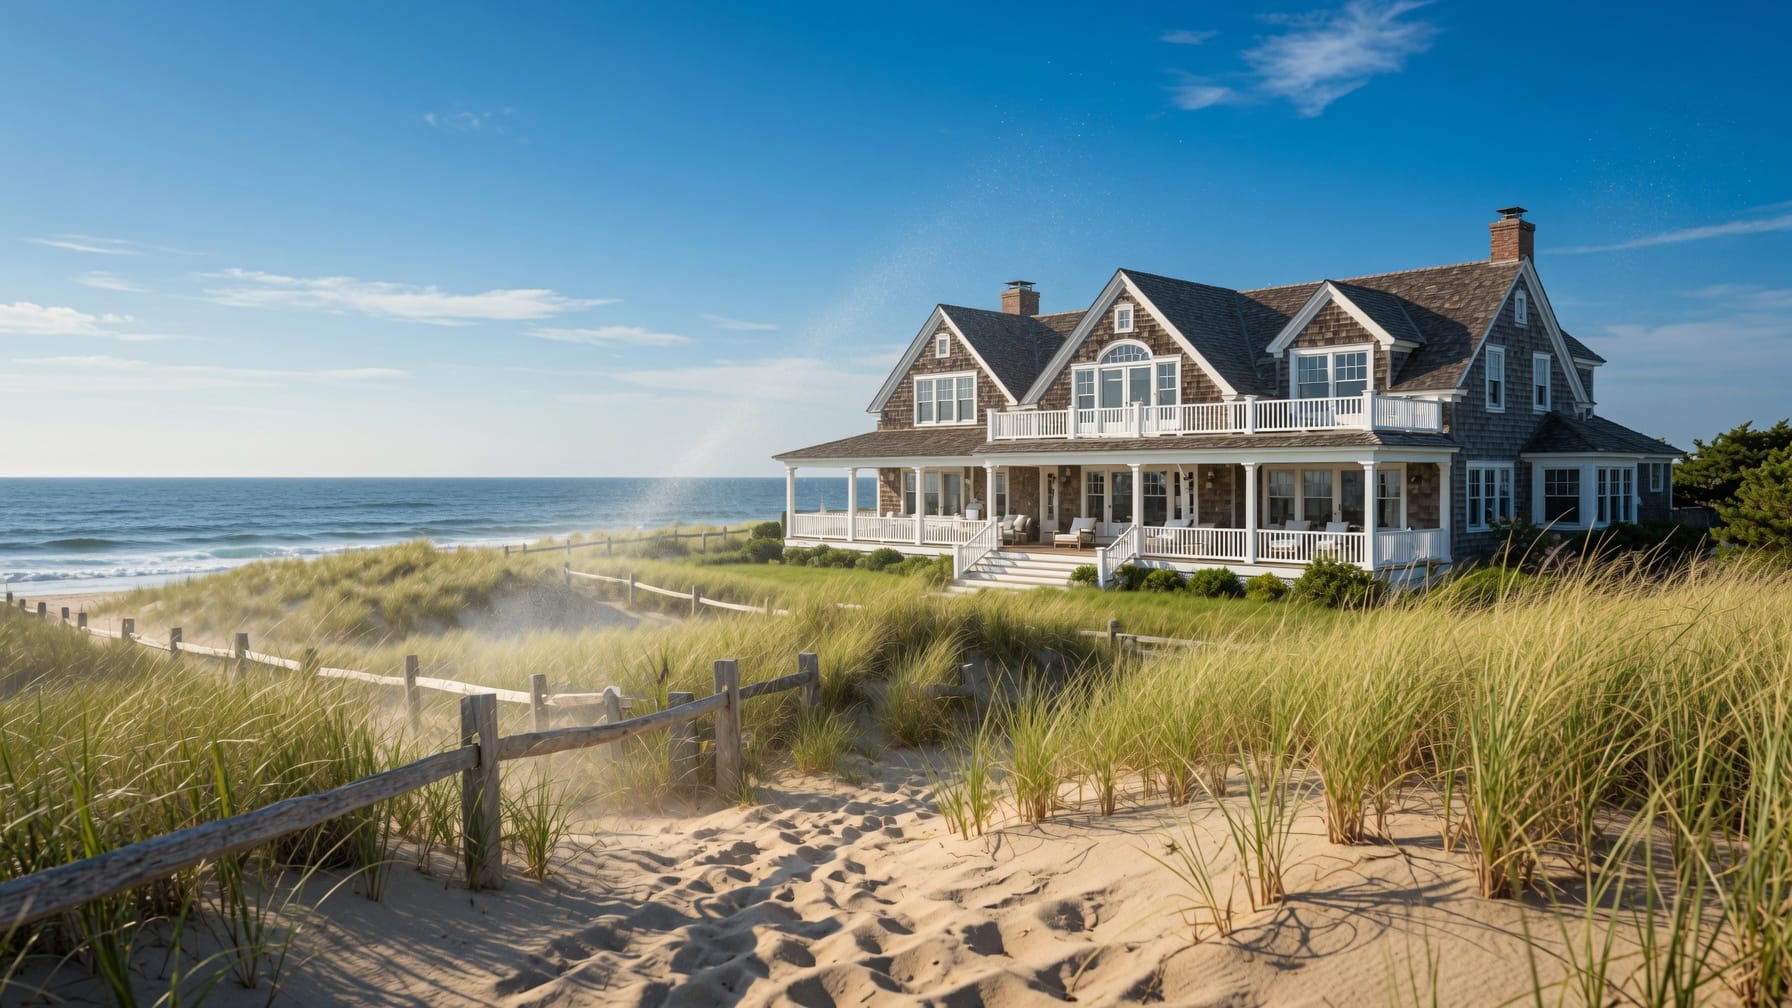
A modest three-bedroom in Levittown pays a higher property-tax rate than an oceanfront estate in Amagansett. Not a slightly higher rate. About twenty times higher.
The Amagansett house — figure roughly $3 million — carries a full-value tax rate near 0.13%. The Levittown house, worth around $720,000, sits at 2.67%, the steepest rate on Long Island. Run the rough math and the cheaper tax bill, by a wide margin, lands on the far more expensive house: an estimated $3,900 a year in Amagansett against roughly $19,000 in Levittown. The four-times-pricier home pays about a fifth of the tax.
That single comparison is the thing almost every "Long Island property tax" article gets wrong, because most of them quote one number for a whole county — "Suffolk is about 2.4%" — and call it a day. Long Island doesn't have a property tax rate. It has hundreds of them, and the gap between the top and the bottom is enormous. This guide maps all of it: every town and hamlet we could pin to a verifiable 2025 rate, what that translates to in real dollars, and what you can actually do about your own bill.
Jump to a section
- The short version
- The Long Island numbers, in context
- How a Long Island tax bill actually gets built
- Look up your town: the full rate table
- What it costs in real dollars
- How to cut your bill: grievances and exemptions
- School districts: the line that moves your bill
- The East End: how the Hamptons pays the lowest rates on Long Island
- The cities: Glen Cove and Long Beach
- What changed from 2024 to 2025
- FAQ
- Methodology and sources
The short version
If you only read one section, read this one.
- Rates run from about 0.02% to 2.67%. Across the 232 Long Island communities with a 2025 full-value rate, the median is roughly 1.43%. Where your house sits in that range matters far more than which county you're in.
- The highest rates are all in Nassau — and clustered on the central South Shore. Levittown leads at 2.67%, followed by North Merrick (2.39%), Jericho (2.23%), Merrick (2.20%), North Bellmore (2.19%), and Baldwin (2.14%).
- The lowest rates are all on Suffolk's East End. Sagaponack (0.02%), Wainscott (0.09%), Quogue (0.13%), Bridgehampton (0.13%), and Amagansett (0.13%) pay rates that look like typos next to the rest of the Island.
- Low rate doesn't mean low bill. The biggest estimated dollar bills land on Nassau's Gold Coast — Sands Point and Matinecock around $47,000 a year — where modest rates meet multimillion-dollar homes.
- School taxes are the bill. On most Long Island bills, the school district is the largest single line by a wide margin. Two houses worth the same amount on opposite sides of a district line can owe meaningfully different taxes.
- You can challenge your assessment for free. Filing a grievance costs nothing and doesn't require a lawyer. Suffolk towns generally hold Grievance Day on the third Tuesday in May; Nassau runs its own earlier calendar through the Assessment Review Commission.
The rest of this guide backs up every one of those points and lets you find your own town.
The Long Island numbers, in context
New York is a high-property-tax state — that part of the reputation is earned. SmartAsset pegs the statewide effective rate near 1.45%, and Long Island generally runs at or above that. But the headline you'll see repeated everywhere — some version of "Nassau is about 1.79%, Suffolk about 2.42%" — is close to useless the moment you try to do anything with it.
Here's why. Suffolk County contains both Bayport, where effective rates push past 2.5%, and Sagaponack, where the full-value rate is 0.02%. Averaging those into a single county figure is like averaging the temperature in a freezer and an oven and reporting that your kitchen is comfortable. The county number hides the only thing you actually care about: what your specific community pays.
A quick word on the two counties, because they genuinely work differently.
Nassau reassesses through a single county Department of Assessment and a single county Assessment Review Commission. One countywide system, one set of deadlines. Nassau is also where Long Island's highest rates live — the central South Shore belt running through Levittown, the Merricks, the Bellmores, and Baldwin all sit above 2.1%.
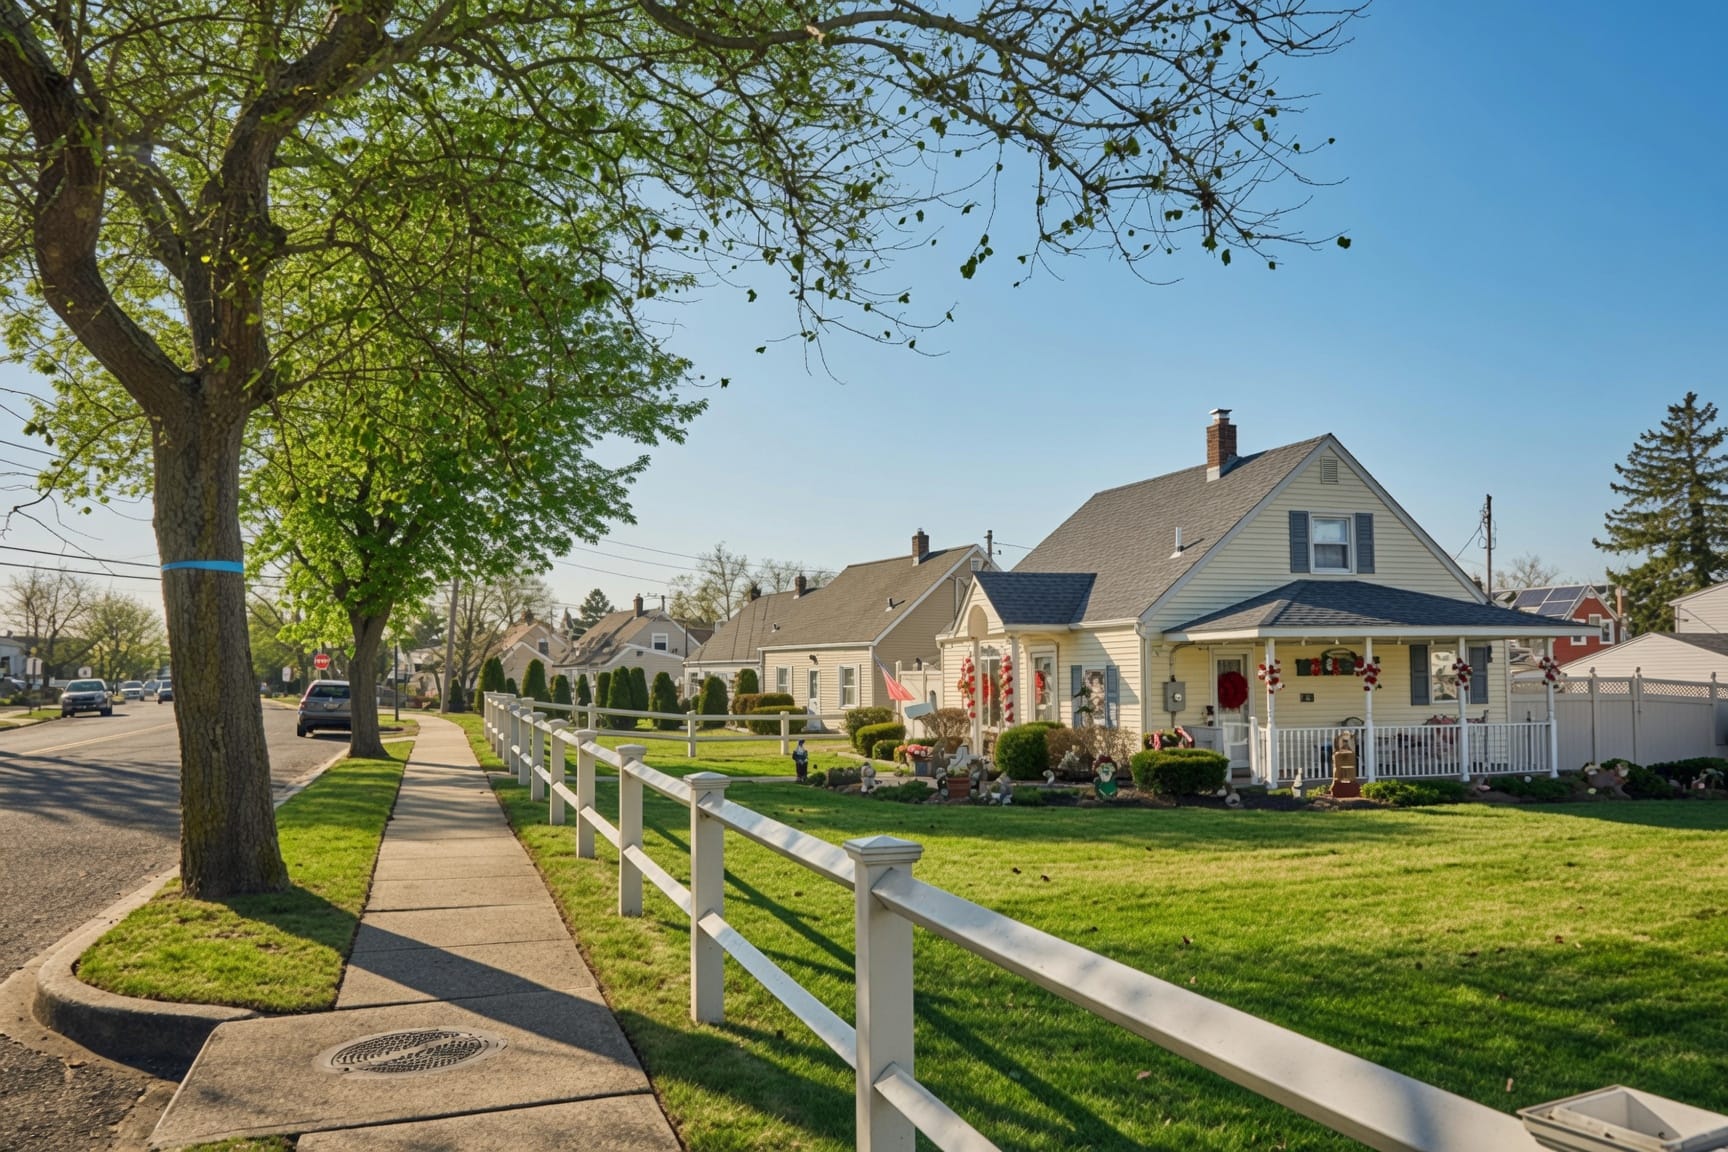
Suffolk is decentralized. Each of its ten towns runs its own assessing operation, with its own assessment ratio and its own Grievance Day. Suffolk is where the rate spread gets wild — central and South Shore Suffolk towns often land between 1.2% and 1.8%, while the East End towns assess property at such a small fraction of market value that their full-value rates collapse toward zero.
Keep that split in mind as you read the table. "Long Island taxes" is really two counties, ten Suffolk towns, three Nassau towns plus two cities, and several hundred school-district-and-village combinations stacked on top.
How a Long Island tax bill actually gets built
Most people never need this section until they're staring at a bill that seems too high. Then it matters a lot. Here's the machinery, in plain terms.
Assessed value is not market value. Your assessment is what the town's assessor says your property is worth for tax purposes — and on Long Island, that figure is usually a small, deliberate fraction of what the house would actually sell for. That fraction is the level of assessment, and it's the source of nearly all the confusion.
The full-value (or effective) rate is the number that lets you compare towns. Because every town assesses at a different fraction of market value, the "rate per $1,000 of assessed value" printed on a bill is meaningless across town lines. To compare apples to apples, you convert everything back to market value: total taxes levied divided by the town's true market value. That's the full-value tax rate, and it's the metric this guide uses throughout. When you read "Levittown 2.67%," it means the taxes work out to about $26.70 for every $1,000 of real market value.
The Residential Assessment Ratio (RAR) shows how far assessed and market value drift apart. The RAR is the ratio of assessed value to market value for residential property in a town, and the numbers are all over the map. Published figures put Huntington's RAR near 0.46%, Brookhaven's around 0.53%, Babylon's at 0.67%, Smithtown's at 0.86% — and then Riverhead at 8.34% and Islip at 7.10%. Those aren't tax rates; they're a measure of how compressed each town's assessment roll is. The takeaway: never compare two towns by the rate printed on the bill. Only the full-value rate is honest.
The equalization rate keeps multi-town school districts fair. New York has more than 700 school districts that cross municipal lines. If one town assessed at 5% of value and the next at 50%, the low-assessment town would dodge its share of the shared school levy. The state's equalization rate corrects for that, redistributing the burden so each slice of a district pays its fair portion. A rate of 100% means a town assesses at full market value; below 100% means it assesses for less.
STAR knocks money off the school portion. The School Tax Relief program is the exemption most Long Island homeowners actually use. Basic STAR is open to owner-occupants using the home as a primary residence with household income under $250,000; for the 2026–27 school year its base exemption is $30,000 of assessed value. Enhanced STAR, for owners 65 and older within the income limit, uses a base of $88,500. It comes off your school taxes, which is exactly where it does the most good — because on Long Island, school taxes are the bill.
That last point deserves its own paragraph, so here it is: the school district is the single biggest driver of what you pay. County and town charges are real, but the school levy typically dwarfs them. It's why two identical houses a block apart can owe different taxes — they're in different districts. When you look up your community in the table below, the school district column isn't trivia. It's the engine.
Look up your town: the full rate table
This is the part no other guide gives you: every Long Island community we could match to a verified 2025 full-value rate, with its school district and a 2026 dollar estimate where a current median value exists. The standard rate guides cover nine towns and assign most of them the same flat "~2.50%." Nine different towns do not share one tax rate, and this table shows the real spread.
Two things to read carefully before you scan:
- The rate is the 2025 full-value (gross) rate from the New York State Comptroller — total levy divided by market value, before STAR or any other exemption. It runs higher than the post-exemption "effective rate" you'll see on Zillow or SmartAsset. That's the honest number for ranking towns; just don't mistake it for the line on your bill after exemptions.
- The dollar column is a clearly-labeled estimate — median home value times the gross rate. It deliberately overstates a real bill because it ignores STAR, veterans, and senior exemptions. Use it to compare communities, not to predict your check to the receiver of taxes.
A dash means we didn't have a current 2026 median value for that hamlet, so we left the dollar estimate blank rather than guess.
Nassau County
| Town / Hamlet | School District | Full-Value Tax Rate (2025) | Median Home Value (2026) | Est. Gross Annual Tax |
|---|---|---|---|---|
| Albertson | Mineola UFSD | 1.10% | $1,089,893 | $11,989 |
| Baldwin | Baldwin UFSD | 2.14% | $713,412 | $15,243 |
| Baxter Estates | Port Washington UFSD | 1.44% | $1,406,605 | $20,279 |
| Bay Park | Oceanside UFSD | 1.53% | — | — |
| Bellmore | Bellmore UFSD | 2.10% | $818,447 | $17,176 |
| Bethpage | Bethpage UFSD | 1.49% | $781,915 | $11,637 |
| Brookside | Hempstead UFSD | 1.07% | — | — |
| Brookville | Locust Valley CSD | 1.68% | — | — |
| Carle Place | Carle Place UFSD | 1.24% | $848,305 | $10,499 |
| Cedarhurst | Hewlett-Woodmere UFSD | 2.03% | $1,211,734 | $24,553 |
| Centre Island | Oyster Bay-East Norwich CSD | 1.14% | $3,026,056 | $34,552 |
| Cold Spring Harbor | Cold Spring Harbor CSD | 1.74% | $1,667,727 | $29,043 |
| Cove Neck | Oyster Bay-East Norwich CSD | 1.14% | — | — |
| East Atlantic Beach | Lawrence UFSD | 0.66% | — | — |
| East Garden City | Hempstead UFSD | 1.07% | — | — |
| East Hills | Roslyn UFSD | 1.32% | — | — |
| East Massapequa | Massapequa UFSD | 1.91% | — | — |
| East Meadow | East Meadow UFSD | 1.85% | $812,766 | $15,010 |
| East Norwich | Oyster Bay-East Norwich CSD | 1.14% | $999,797 | $11,416 |
| East Rockaway | East Rockaway UFSD | 1.68% | $736,888 | $12,378 |
| East Williston | East Williston UFSD | 1.81% | $1,395,132 | $25,237 |
| Elmont | Elmont UFSD | 1.50% | $722,645 | $10,851 |
| Farmingdale | Farmingdale UFSD | 1.69% | $722,310 | $12,242 |
| Flower Hill | Manhasset UFSD | 0.96% | — | — |
| Franklin Square | Franklin Square UFSD | 1.51% | $804,785 | $12,155 |
| Freeport | Freeport UFSD | 0.96% | $656,967 | $6,316 |
| Garden City | Garden City UFSD | 1.14% | $1,384,905 | $15,744 |
| Garden City Park | New Hyde Park-Garden City Park UFSD | 1.12% | $974,173 | $10,890 |
| Garden City South | Garden City UFSD | 1.14% | $864,176 | $9,824 |
| Glen Cove | Glen Cove City School District | 1.39% | $810,158 | $11,247 |
| Glen Head | North Shore CSD | 1.07% | $1,346,028 | $14,466 |
| Glenwood Landing | North Shore CSD | 1.07% | $999,198 | $10,738 |
| Great Neck | Great Neck UFSD | 1.00% | $1,480,335 | $14,768 |
| Great Neck Estates | Great Neck UFSD | 1.00% | $2,088,811 | $20,838 |
| Great Neck Plaza | Great Neck UFSD | 1.00% | $578,017 | $5,766 |
| Greenvale | North Shore CSD | 1.07% | $1,005,465 | $10,806 |
| Hempstead | Hempstead UFSD | 1.07% | $629,019 | $6,751 |
| Herricks | Herricks UFSD | 1.81% | — | — |
| Hewlett | Hewlett-Woodmere UFSD | 2.03% | $928,167 | $18,807 |
| Hewlett Harbor | Hewlett-Woodmere UFSD | 2.03% | $2,022,391 | $40,980 |
| Hicksville | Hicksville UFSD | 1.07% | $782,394 | $8,404 |
| Hillside Manor | Mineola UFSD | 1.10% | — | — |
| Huntington | Huntington UFSD | 1.28% | $861,527 | $11,067 |
| Inwood | Lawrence UFSD | 0.66% | $821,856 | $5,424 |
| Island Park | Island Park UFSD | 1.20% | $746,327 | $8,925 |
| Jericho | Jericho UFSD | 2.23% | $1,276,390 | $28,486 |
| Kings Point | Great Neck UFSD | 1.00% | $3,346,409 | $33,384 |
| Lake Success | Great Neck UFSD | 1.00% | $1,820,590 | $18,162 |
| Lakeview | Hempstead UFSD | 1.07% | $713,121 | $7,653 |
| Lattingtown | Locust Valley CSD | 1.68% | $1,643,083 | $27,533 |
| Laurel Hollow | Cold Spring Harbor CSD | 1.74% | $2,282,044 | $39,742 |
| Lawrence | Lawrence UFSD | 0.66% | $2,145,127 | $14,158 |
| Levittown | Levittown UFSD | 2.67% | $720,478 | $19,238 |
| Lido Beach | Long Beach City School District | 1.14% | $1,063,888 | $12,139 |
| Locust Valley | Locust Valley CSD | 1.68% | $1,198,340 | $20,081 |
| Long Beach | Long Beach City School District | 1.14% | $806,707 | $9,205 |
| Lynbrook | Lynbrook UFSD | 1.57% | $743,226 | $11,635 |
| Malverne | Malverne UFSD | 1.75% | $803,204 | $14,072 |
| Manhasset | Manhasset UFSD | 0.96% | $2,238,792 | $21,499 |
| Manhasset Hills | Herricks UFSD | 1.81% | $1,468,601 | $26,554 |
| Massapequa | Massapequa UFSD | 1.91% | $816,631 | $15,568 |
| Massapequa Park | Massapequa UFSD | 1.91% | $808,968 | $15,422 |
| Matinecock | Locust Valley CSD | 1.68% | $2,801,404 | $46,943 |
| Merrick | Merrick UFSD | 2.20% | $880,683 | $19,380 |
| Mill Neck | Locust Valley CSD | 1.68% | $2,185,479 | $36,622 |
| Mineola | Mineola UFSD | 1.10% | $820,633 | $9,027 |
| Munsey Park | Manhasset UFSD | 0.96% | $2,497,467 | $23,983 |
| Muttontown | Syosset CSD | 1.71% | $2,314,210 | $39,548 |
| New Hyde Park | New Hyde Park-Garden City Park UFSD | 1.12% | $987,231 | $11,036 |
| North Bellmore | North Bellmore UFSD | 2.19% | $798,345 | $17,475 |
| North Hills | Manhasset UFSD | 0.96% | — | — |
| North Massapequa | Massapequa UFSD | 1.91% | — | — |
| North Merrick | North Merrick UFSD | 2.39% | $835,578 | $19,978 |
| North Valley Stream | Valley Stream 13 UFSD | 1.81% | — | — |
| North Wantagh | Wantagh UFSD | 1.95% | — | — |
| North Woodmere | Hewlett-Woodmere UFSD | 2.03% | — | — |
| Oceanside | Oceanside UFSD | 1.53% | $777,820 | $11,905 |
| Old Bethpage | Plainview-Old Bethpage CSD | 1.69% | $1,002,692 | $16,982 |
| Old Brookville | North Shore CSD | 1.07% | $2,814,735 | $30,250 |
| Old Westbury | Westbury UFSD | 0.57% | $2,905,414 | $16,509 |
| Oyster Bay | Oyster Bay-East Norwich CSD | 1.14% | $1,043,503 | $11,915 |
| Oyster Bay Cove | Syosset CSD | 1.71% | $2,325,456 | $39,740 |
| Plainedge | Plainedge UFSD | 2.05% | — | — |
| Plainview | Plainview-Old Bethpage CSD | 1.69% | $981,251 | $16,618 |
| Plandome | Manhasset UFSD | 0.96% | $3,406,245 | $32,710 |
| Plandome Heights | Manhasset UFSD | 0.96% | $2,057,897 | $19,762 |
| Plandome Manor | Manhasset UFSD | 0.96% | $2,911,774 | $27,962 |
| Point Lookout | Long Beach City School District | 1.14% | $1,418,066 | $16,180 |
| Port Washington | Port Washington UFSD | 1.44% | $1,276,305 | $18,400 |
| Port Washington North | Port Washington UFSD | 1.44% | $1,302,796 | $18,782 |
| Rockville Centre | Rockville Centre UFSD | 1.76% | $989,236 | $17,430 |
| Roosevelt | Roosevelt UFSD | 1.45% | $636,315 | $9,251 |
| Roslyn | Roslyn UFSD | 1.32% | $1,652,475 | $21,866 |
| Roslyn Estates | Roslyn UFSD | 1.32% | $2,067,028 | $27,351 |
| Roslyn Harbor | Roslyn UFSD | 1.32% | $2,041,076 | $27,008 |
| Roslyn Heights | Roslyn UFSD | 1.32% | $1,450,119 | $19,188 |
| Russell Gardens | Manhasset UFSD | 0.96% | — | — |
| Sands Point | Port Washington UFSD | 1.44% | $3,265,695 | $47,082 |
| Sea Cliff | North Shore CSD | 1.07% | $1,128,839 | $12,132 |
| Seaford | Seaford UFSD | 2.02% | $792,214 | $16,030 |
| Searingtown | Herricks UFSD | 1.81% | — | — |
| South Farmingdale | Farmingdale UFSD | 1.69% | — | — |
| South Hempstead | Hempstead UFSD | 1.07% | $716,102 | $7,685 |
| South Valley Stream | Valley Stream 24 UFSD | 1.69% | $875,070 | $14,781 |
| Stewart Manor | Elmont UFSD | 1.50% | $907,302 | $13,623 |
| Strathmore | Manhasset UFSD | 0.96% | — | — |
| Syosset | Syosset CSD | 1.71% | $1,110,286 | $18,974 |
| Thomaston | Great Neck UFSD | 1.00% | $1,375,061 | $13,718 |
| Uniondale | Uniondale UFSD | 0.83% | $678,850 | $5,624 |
| University Gardens | Great Neck UFSD | 1.00% | $1,209,129 | $12,062 |
| Upper Brookville | North Shore CSD | 1.07% | $2,653,516 | $28,517 |
| Valley Stream | Valley Stream 13 UFSD | 1.81% | $757,131 | $13,730 |
| Wantagh | Wantagh UFSD | 1.95% | $809,855 | $15,816 |
| West Hempstead | West Hempstead UFSD | 1.70% | $779,618 | $13,269 |
| Westbury | Westbury UFSD | 0.57% | $771,758 | $4,385 |
| Williston Park | Herricks UFSD | 1.81% | $931,179 | $16,837 |
| Woodbury | Syosset CSD | 1.71% | $1,477,075 | $25,242 |
| Woodmere | Hewlett-Woodmere UFSD | 2.03% | $1,347,982 | $27,314 |
Suffolk County
| Town / Hamlet | School District | Full-Value Tax Rate (2025) | Median Home Value (2026) | Est. Gross Annual Tax |
|---|---|---|---|---|
| Amagansett | Amagansett UFSD | 0.13% | $3,027,217 | $3,902 |
| Amityville | Amityville UFSD | 1.37% | $601,075 | $8,218 |
| Babylon | Babylon UFSD | 1.67% | $744,315 | $12,417 |
| Bay Shore | Bay Shore UFSD | 1.73% | $655,874 | $11,345 |
| Bayport | Bayport-Blue Point UFSD | 1.99% | $781,119 | $15,517 |
| Bayport-Blue Point | Bayport-Blue Point UFSD | 1.99% | — | — |
| Bellport | Bayport-Blue Point UFSD | 1.99% | $603,655 | $11,992 |
| Blue Point | Bayport-Blue Point UFSD | 1.99% | $696,114 | $13,828 |
| Bohemia | Connetquot CSD | 1.48% | $718,171 | $10,638 |
| Brentwood | Brentwood UFSD | 1.18% | $605,072 | $7,112 |
| Bridgehampton | Bridgehampton UFSD | 0.13% | $4,600,461 | $5,875 |
| Brookhaven | Sachem CSD | 1.28% | $697,089 | $8,938 |
| Calverton | Riverhead CSD | 0.98% | $647,641 | $6,317 |
| Center Moriches | Center Moriches UFSD | 1.55% | $676,587 | $10,511 |
| Centereach | Middle Country CSD | 1.60% | $648,039 | $10,371 |
| Centerport | Harborfields CSD | 1.44% | $922,762 | $13,248 |
| Central Islip | Central Islip UFSD | 1.95% | $557,505 | $10,848 |
| Cold Spring Harbor | Cold Spring Harbor CSD | 1.74% | $1,667,727 | $29,043 |
| Commack | Commack UFSD | 1.64% | $794,019 | $13,030 |
| Copiague | Copiague UFSD | 1.51% | $588,897 | $8,883 |
| Coram | Longwood CSD | 1.60% | $550,881 | $8,802 |
| Cutchogue | Mattituck-Cutchogue UFSD | 0.53% | $1,201,246 | $6,417 |
| Deer Park | Deer Park UFSD | 1.57% | $651,786 | $10,243 |
| Dix Hills | Half Hollow Hills CSD | 1.25% | $1,112,431 | $13,948 |
| East Hampton | East Hampton UFSD | 0.22% | $2,007,563 | $4,437 |
| East Islip | East Islip UFSD | 1.44% | $706,522 | $10,187 |
| East Moriches | East Moriches UFSD | 1.48% | $768,818 | $11,406 |
| East Northport | Northport-East Northport UFSD | 1.08% | $758,573 | $8,174 |
| East Patchogue | Patchogue-Medford UFSD | 1.61% | — | — |
| East Quogue | East Quogue UFSD | 0.71% | $1,138,958 | $8,042 |
| Eastport | Eastport-South Manor CSD | 1.68% | $802,275 | $13,465 |
| Elwood | Elwood UFSD | 1.59% | — | — |
| Farmingdale | Farmingdale UFSD | 1.69% | $722,310 | $12,242 |
| Farmingville | Sachem CSD | 1.28% | $638,286 | $8,184 |
| Flanders | Eastport-South Manor CSD | 1.68% | — | — |
| Gordon Heights | Longwood CSD | 1.60% | — | — |
| Great River | East Islip UFSD | 1.44% | $1,123,404 | $16,197 |
| Greenlawn | Harborfields CSD | 1.44% | $821,605 | $11,796 |
| Greenport | Greenport UFSD | 0.65% | $982,821 | $6,366 |
| Halesite | Huntington UFSD | 1.28% | $876,999 | $11,266 |
| Hampton Bays | Hampton Bays UFSD | 0.80% | $937,304 | $7,482 |
| Hauppauge | Hauppauge UFSD | 1.23% | $799,997 | $9,834 |
| Holbrook | Sachem CSD | 1.28% | $672,468 | $8,622 |
| Holtsville | Sachem CSD | 1.28% | $647,761 | $8,306 |
| Huntington | Huntington UFSD | 1.28% | $861,527 | $11,067 |
| Huntington Station | Huntington UFSD | 1.28% | $646,891 | $8,310 |
| Islip | Islip UFSD | 1.77% | $666,987 | $11,828 |
| Islip Terrace | Islip UFSD | 1.77% | $633,771 | $11,239 |
| Jamesport | Riverhead CSD | 0.98% | $916,696 | $8,941 |
| Kings Park | Kings Park CSD | 1.47% | $739,060 | $10,827 |
| Lake Ronkonkoma | Sachem CSD | 1.28% | — | — |
| Laurel | Mattituck-Cutchogue UFSD | 0.53% | $1,016,034 | $5,428 |
| Lindenhurst | Lindenhurst UFSD | 1.72% | $619,911 | $10,633 |
| Mastic | William Floyd UFSD | 1.30% | $501,554 | $6,511 |
| Mastic Beach | William Floyd UFSD | 1.30% | $473,867 | $6,152 |
| Mattituck | Mattituck-Cutchogue UFSD | 0.53% | $995,058 | $5,316 |
| Medford | Patchogue-Medford UFSD | 1.61% | $608,595 | $9,774 |
| Melville | Half Hollow Hills CSD | 1.25% | $886,408 | $11,114 |
| Middle Island | Longwood CSD | 1.60% | $492,510 | $7,869 |
| Miller Place | Miller Place UFSD | 1.61% | — | — |
| Montauk | Montauk UFSD | 0.20% | — | — |
| Moriches | East Moriches UFSD | 1.48% | — | — |
| Mount Sinai | Mount Sinai UFSD | 1.58% | — | — |
| Nesconset | Smithtown CSD | 1.57% | — | — |
| New Suffolk | New Suffolk Common SD | 0.24% | — | — |
| North Babylon | North Babylon UFSD | 1.53% | — | — |
| North Patchogue | Patchogue-Medford UFSD | 1.61% | — | — |
| North Sea | Southampton UFSD | 0.13% | — | — |
| Northport | Northport-East Northport UFSD | 1.08% | — | — |
| Northville | Riverhead CSD | 0.98% | — | — |
| Oakdale | Connetquot CSD | 1.48% | — | — |
| Ocean Beach | Fire Island UFSD | 0.13% | — | — |
| Orient | Oysterponds UFSD | 0.18% | — | — |
| Oysterponds | Oysterponds UFSD | 0.18% | — | — |
| Patchogue | Patchogue-Medford UFSD | 1.61% | — | — |
| Peconic | Southold UFSD | 0.53% | — | — |
| Port Jefferson | Port Jefferson UFSD | 1.07% | — | — |
| Port Jefferson Station | Brookhaven-Comsewogue UFSD | 1.54% | — | — |
| Quogue | Quogue UFSD | 0.13% | — | — |
| Remsenburg | Remsenburg-Speonk UFSD | 0.36% | — | — |
| Ridge | Shoreham-Wading River CSD | 1.42% | — | — |
| Riverhead | Riverhead CSD | 0.98% | — | — |
| Rocky Point | Rocky Point UFSD | 1.74% | — | — |
| Ronkonkoma | Sachem CSD | 1.28% | $622,313 | $7,979 |
| Sag Harbor | Sag Harbor UFSD | 0.29% | — | — |
| Sagaponack | Sagaponack Common SD | 0.02% | — | — |
| Saint James | Smithtown CSD | 1.57% | — | — |
| Sayville | Sayville UFSD | 1.65% | — | — |
| Selden | Middle Country CSD | 1.60% | — | — |
| Shelter Island | Shelter Island UFSD | 0.20% | — | — |
| Shelter Island Heights | Shelter Island UFSD | 0.20% | — | — |
| Shinnecock Hills | Southampton UFSD | 0.13% | — | — |
| Shoreham | Shoreham-Wading River CSD | 1.42% | — | — |
| Smithtown | Smithtown CSD | 1.57% | — | — |
| Sound Beach | Miller Place UFSD | 1.61% | — | — |
| South Huntington | South Huntington UFSD | 1.46% | — | — |
| Southampton | Southampton UFSD | 0.13% | — | — |
| Southold | Southold UFSD | 0.53% | — | — |
| Speonk | Remsenburg-Speonk UFSD | 0.36% | — | — |
| Springs | Springs UFSD | 0.47% | — | — |
| Stony Brook | Three Village CSD | 1.67% | — | — |
| Terryville | Brookhaven-Comsewogue UFSD | 1.54% | — | — |
| Upton | Brookhaven-Comsewogue UFSD | 1.54% | — | — |
| Wading River | Shoreham-Wading River CSD | 1.42% | — | — |
| Wainscott | Wainscott Common SD | 0.09% | — | — |
| Water Mill | Southampton UFSD | 0.13% | — | — |
| West Babylon | West Babylon UFSD | 1.68% | — | — |
| West Hills | Half Hollow Hills CSD | 1.25% | — | — |
| West Islip | West Islip UFSD | 1.51% | — | — |
| West Sayville | Sayville UFSD | 1.65% | — | — |
| Westhampton | Westhampton Beach UFSD | 0.39% | — | — |
| Westhampton Beach | Westhampton Beach UFSD | 0.39% | — | — |
| Wyandanch | Wyandanch UFSD | 1.62% | — | — |
| Yaphank | Longwood CSD | 1.60% | — | — |
What it costs in real dollars
Rates are the honest way to rank towns. Dollars are what people actually feel — so let's talk dollars, with the caveat that every figure here is an estimate built on the gross rate before exemptions.
Start with the paradox again, because it runs deeper than one example. The lowest rates on Long Island and the highest bills on Long Island sit, roughly, in the same income bracket. The East End pays microscopic rates on enormous values. The Gold Coast pays moderate rates on enormous values. The crushing rates — the 2.1% to 2.67% band — fall on the middle, on the Levittowns and Baldwins and Bellmores, where the homes are worth a fraction of an Amagansett estate but the rate is twenty times higher.
The biggest estimated annual bills cluster on Nassau's North Shore, where rates are unremarkable but values aren't:
- Sands Point — about $47,000 a year (1.44% on a ~$3.27M median)
- Matinecock — about $47,000 (1.68% on ~$2.80M)
- Hewlett Harbor — about $41,000 (2.03% on ~$2.02M)
- Laurel Hollow — about $40,000 (1.74% on ~$2.28M)
- Oyster Bay Cove and Muttontown — about $39,500 each
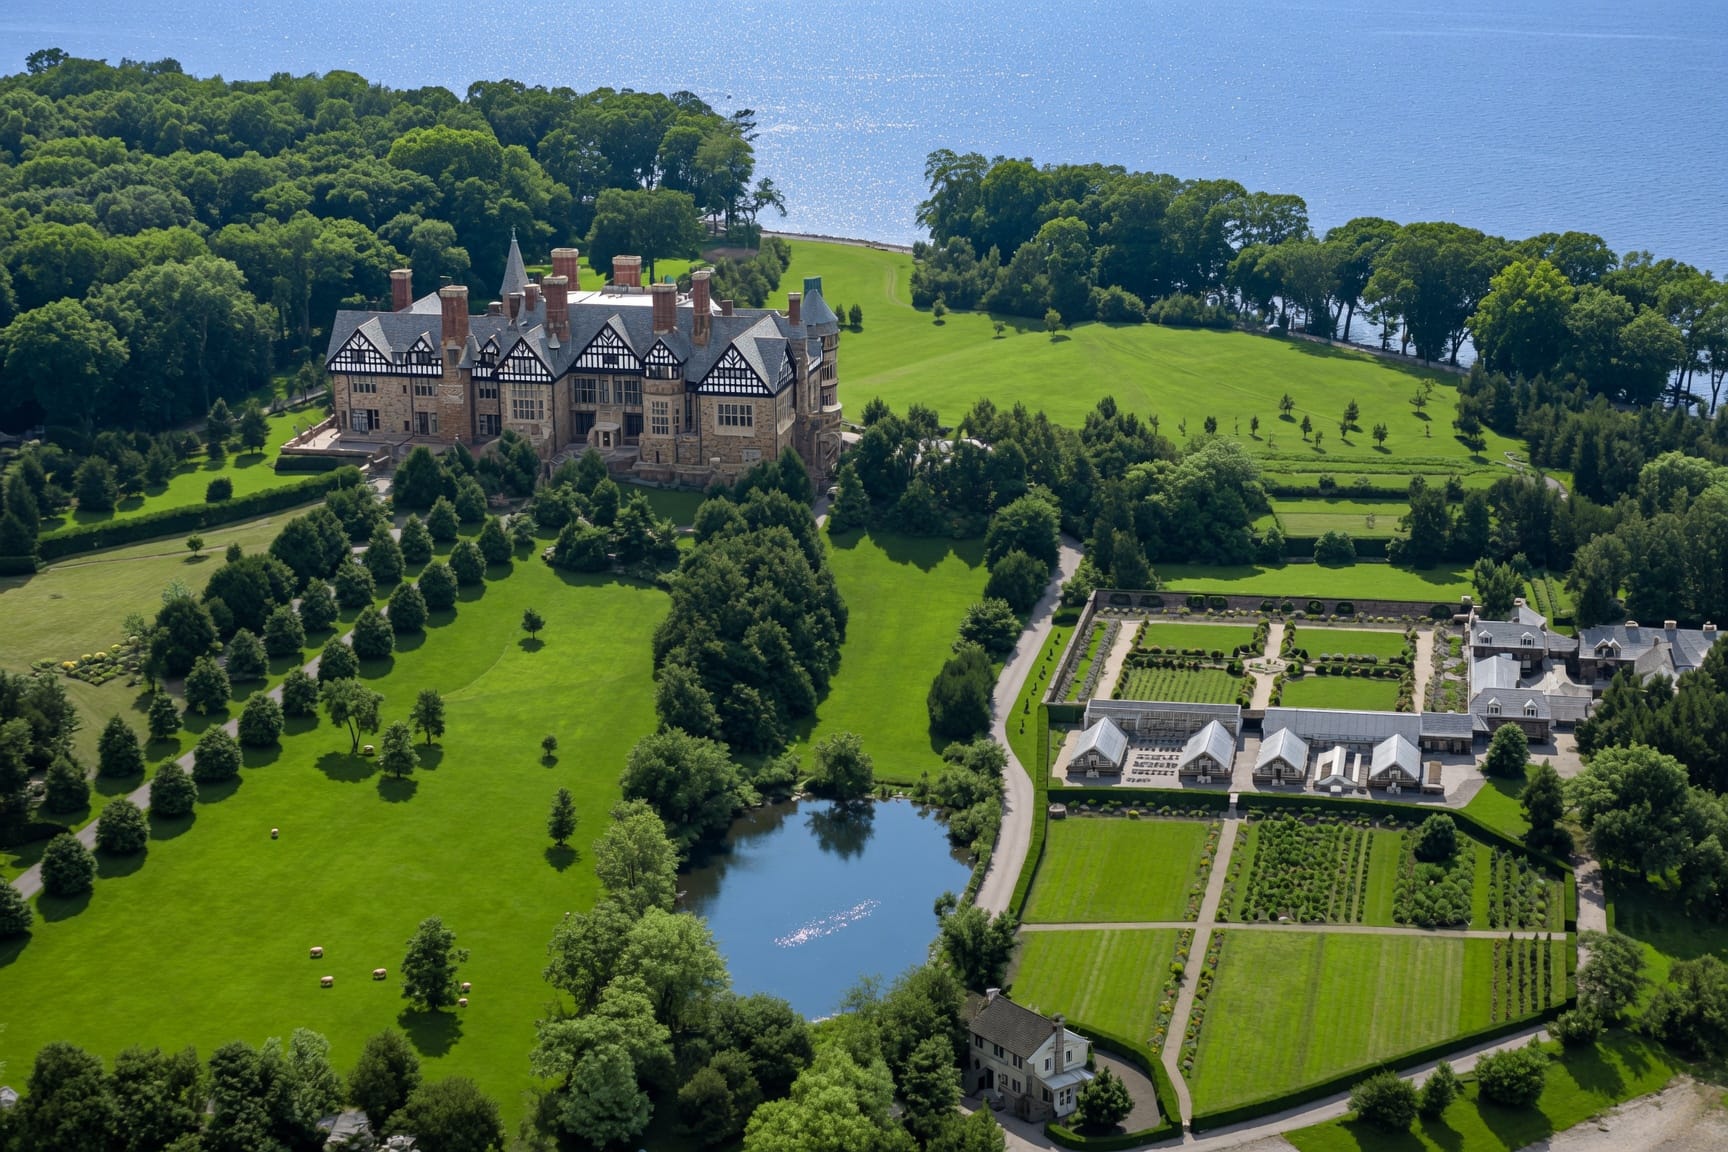
Compare that to the rate leaders. Levittown's nation-leading 2.67% produces an estimated bill near $19,000 — painful, and roughly double what a same-priced house pays in plenty of Suffolk towns, but less than half what Sands Point owes on a house worth four times as much. High rate, mid-size bill. Low rate, giant bill. The two rankings barely overlap.
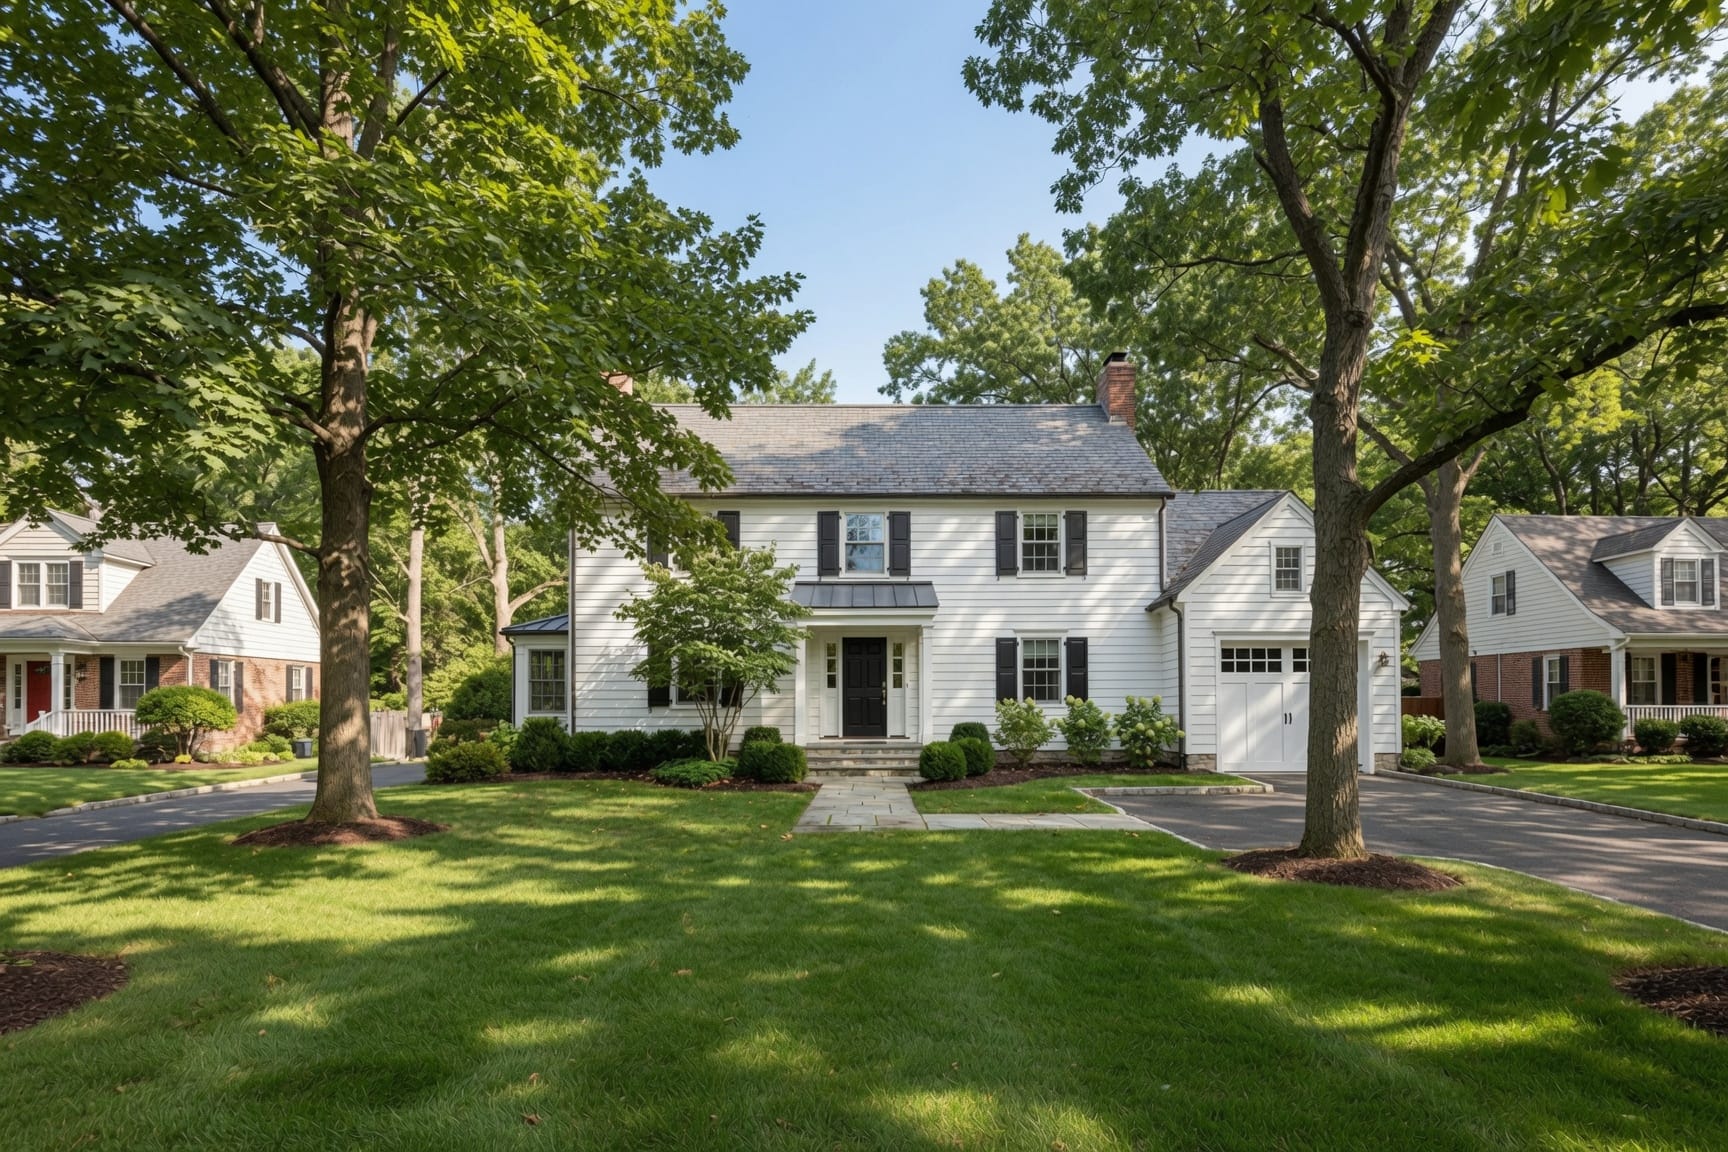
For a homeowner, the practical lesson is to stop thinking in counties and start thinking in your own three numbers: your market value, your full-value rate, and your school district. A $700,000 house pays roughly $8,200 a year at Amityville's 1.37%, about $11,300 at Bay Shore's 1.73%, and about $18,700 at Levittown's 2.67%. Same house, same county region, a $10,000 annual swing depending on which side of which line it sits.
None of this is a reason to sell, but taxes are a fixed cost of owning here, and for some homeowners a heavy bill is part of what tips the decision. If that's where you are, it's worth seeing how a no-fee cash sale on Long Island compares with a traditional listing before you decide.
How to cut your bill: grievances and exemptions
You have two levers. One lowers the value they tax you on. The other carves exemptions off the top. Both are free, and most homeowners under-use both.
Grieve your assessment
If you think your assessment overstates your home's market value, you can challenge it. The process is open to any owner, costs nothing to file, and doesn't require a lawyer or a consultant — though plenty of firms will handle it for a cut of the savings if you'd rather not.
The mechanics, per New York's Office of Real Property Tax Services:
- File Form RP-524, the Complaint on Real Property Assessment, with your assessor or Board of Assessment Review by Grievance Day. On Long Island, Suffolk towns generally hold Grievance Day on the third Tuesday in May. Nassau runs a separate, earlier calendar through its Assessment Review Commission, with a filing deadline that typically falls in late winter or early spring — confirm your exact date, because it moves and because Nassau periodically extends it.
- Make your case to the Board of Assessment Review. You have the right to present evidence — recent comparable sales are the strongest. The assessor attends too.
- If the board says no, you can go to court. Owners of one-, two-, and three-family homes can use Small Claims Assessment Review (SCAR), a low-cost, informal process. Larger or commercial properties use an Article 7 tax certiorari proceeding. Either way, you have to file within 30 days of the final assessment roll.
One catch worth knowing: you can only grieve the assessment on the current tentative roll. Miss the window and you wait a year. So the single most useful thing you can do is mark your town's Grievance Day on the calendar now.
Claim every exemption you qualify for
Exemptions reduce the taxable value before the rate is applied. The big ones on Long Island:
- Basic STAR — primary-residence owners with household income under $250,000. For 2026–27 the base exemption is $30,000 of assessed value, applied to your school taxes.
- Enhanced STAR — owners 65 and older within the state income limit, with a $88,500 base for 2026–27. If you're turning 65, switching from Basic to Enhanced is found money.
- Veterans exemptions — several tiers for wartime service, combat service, and service-connected disability.
- Senior Citizens (Limited Income) — an additional reduction for older owners under local income thresholds, separate from Enhanced STAR and stackable with it.
You apply through your local assessor, and you have to apply by the taxable status date — the same calendar that governs grievances. None of these are automatic. A homeowner who qualifies for Enhanced STAR and a veterans exemption but never filed is simply paying more than the law requires.
School districts: the line that moves your bill
If you remember one structural fact about Long Island taxes, make it this: the school district usually decides the bill, and the district lines don't follow town lines.
Look at how the same name behaves across the table. The hamlet of Brookhaven sits in the Sachem district at about 1.28%. Drive a few minutes and you're in a different district at a different rate, inside the same Town of Brookhaven. "Brookhaven's rate" isn't a real thing — there are many, one per district segment. The standard guides paper over this by reporting a single town-wide figure, which is how you end up with nine Suffolk and Nassau towns all mysteriously assigned "~2.50%." The school district is exactly the granularity that gets erased, and it's the granularity that determines your bill.
This is also why the same house can be a bargain or a burden depending on a property line you can't see. Buyers chasing a specific district for the schools should price the taxes into the decision, not just the tuition they're saving. Sellers should know that a strong, lower-tax district is a feature worth marketing. The district column in the table above is there so you can see, for each community, which engine is actually running your bill — and so you can compare two communities by the thing that matters instead of by the county they share.
The East End: how the Hamptons pays the lowest rates on Long Island
The East End is the best story in Long Island property tax, and almost no guide tells it.
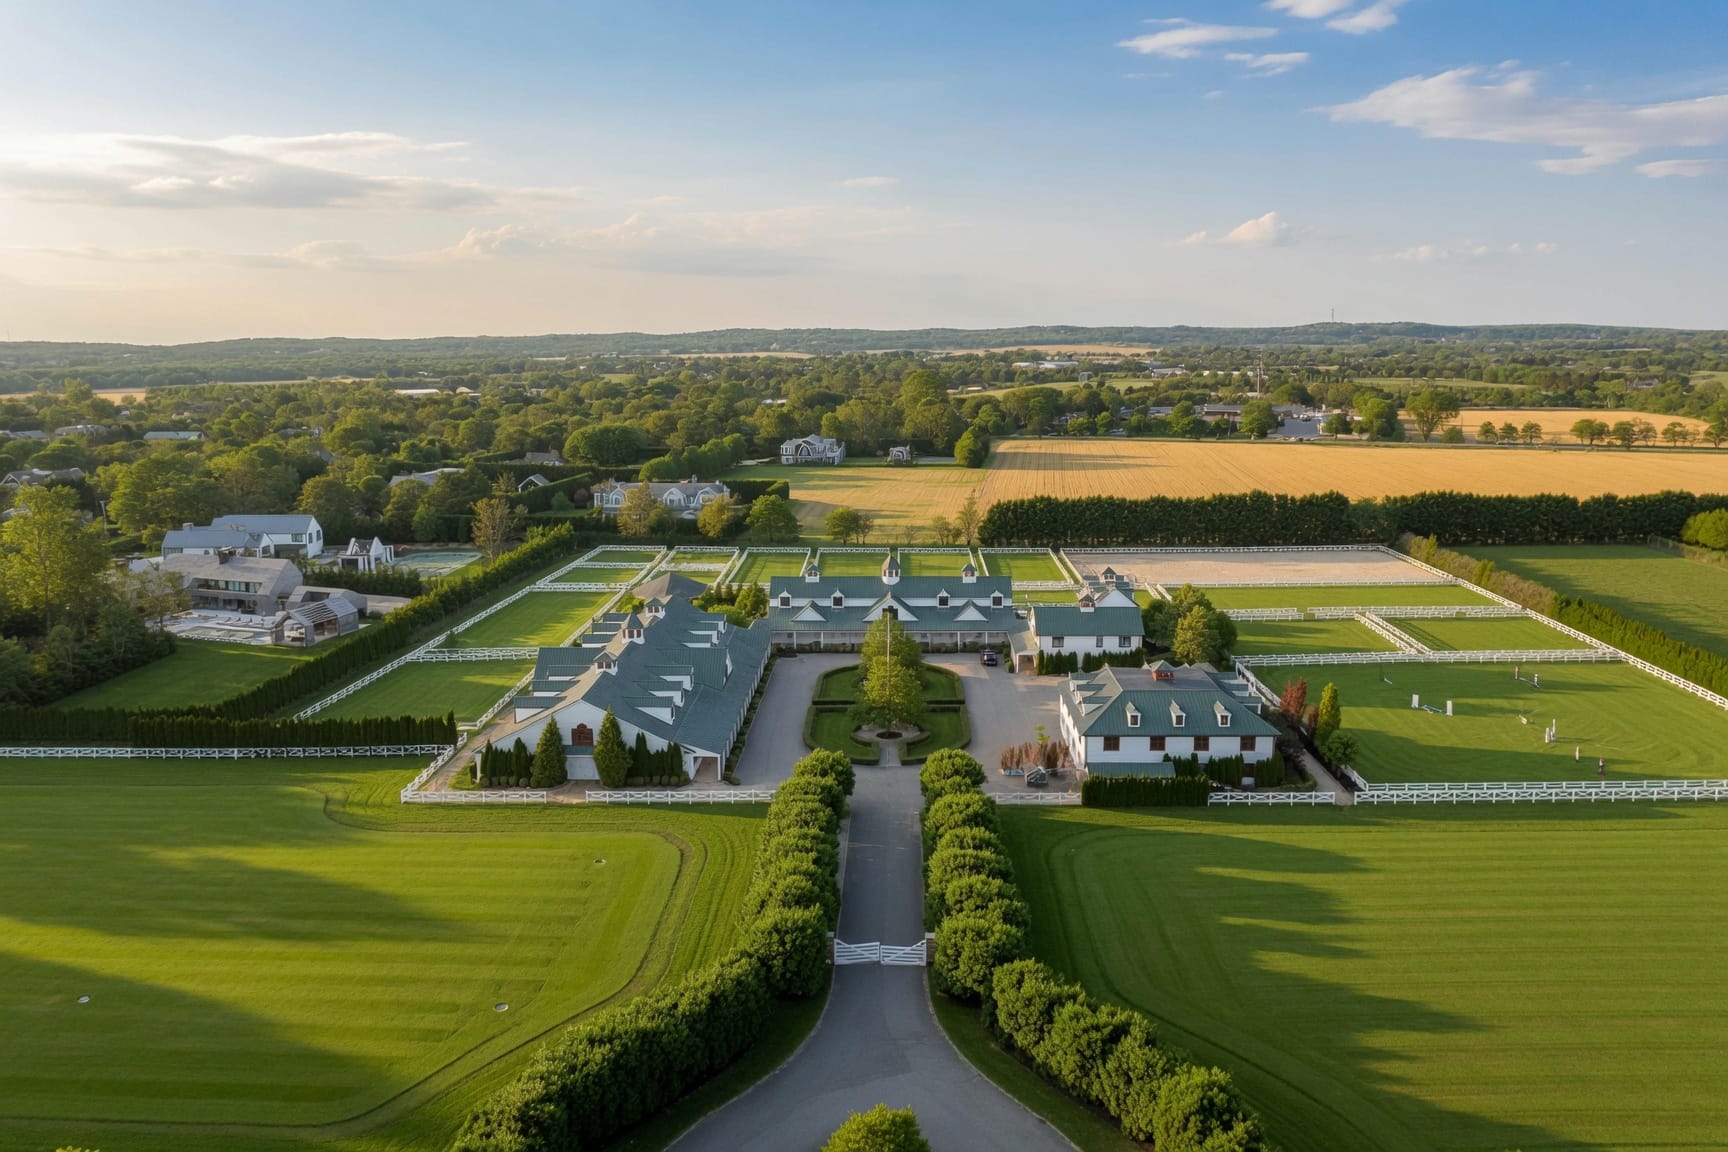
Here's the setup. The five East End towns — Southampton, East Hampton, Southold, Riverhead, and Shelter Island — assess property at a tiny fraction of its real market value. When you divide a relatively modest levy by a sky-high market value, the full-value rate falls through the floor. The result is the cluster of rates that looks like a glitch: Sagaponack at 0.02%, Wainscott at 0.09%, Bridgehampton and Amagansett near 0.13%, Southampton hamlet at 0.13%, East Hampton at 0.22%, Shelter Island at 0.20%, Montauk at 0.20%.
These are real, and they trace to how the East End assesses, not to any special break the rest of us missed. Independent aggregators land in the same neighborhood — they show Bridgehampton effective rates around 0.24% and Shelter Island near 0.46%, lower than anywhere else on the Island — using a different method and arriving at the same "ultra-low" conclusion. The North Fork follows the pattern at a higher floor: Cutchogue and Mattituck sit around 0.53%, still well under half the Island-wide median.
Now the part that keeps it from being a feel-good story: the East End's rates are tiny, but its values are not. A 0.13% rate on a $4.6 million Bridgehampton house still produces an estimated bill near $5,900. That's real money — and yet it's a fraction of what a Levittown owner pays on a $720,000 house taxed at twenty times the rate. A buyer comparing a Hamptons cottage to a starter home off the South Shore can find the cottage carries the lighter burden as a share of value and, in some cases, a smaller dollar bill despite costing several times more. That's a real quirk of the system, and it's exactly the kind of thing a county-level average buries completely.
The cities: Glen Cove and Long Beach
Long Island has two incorporated cities, both in Nassau, and both get skipped by the usual town-by-town guides because they aren't towns. They run their own assessing and their own school district, which makes them worth a look.
Glen Cove, on the North Shore, posts a full-value rate around 1.39% on a median value near $810,000 — an estimated bill in the $11,000 range. Long Beach, the barrier-island city on the South Shore, comes in lower at about 1.14% on a similar median value, for an estimated bill closer to $9,200. Both run their own city school district, which is part of why their rates don't track the surrounding towns. If you're weighing a city address against a nearby unincorporated hamlet, the city's self-contained tax structure is the variable to check — sometimes it works in your favor, as Long Beach's sub-1.2% rate shows.
What changed from 2024 to 2025
We have full-value rates for both 2024 and 2025, which lets us do something no competing guide does: show the trend. The headline looks like good news and mostly isn't.
Across the 232 communities, the full-value rate fell in about 80% of them between 2024 and 2025 — 185 down, 41 up, a handful flat — for an average drop of roughly 6.5%. Before anyone celebrates a tax cut: a falling full-value rate usually means the denominator moved, not your bill. The full-value rate is the levy divided by total market value. When home values climb faster than the amount being taxed, the rate drops even as the dollars you owe hold steady or rise. Long Island values kept climbing into 2026, so most of this "decline" is the market outrunning the levy, not a break for homeowners.
The exceptions are where it gets interesting. The biggest rate increases landed on the North Fork — Cutchogue, Laurel, and Mattituck each up about 7.2% — along with a cluster of South Shore Suffolk hamlets like Copiague, North Babylon, and Lindenhurst, each up 4% to 5%. The steepest rate drops were all in Nassau's southwest corner: Lynbrook fell almost 20%, Valley Stream and North Valley Stream about 18%, East Rockaway 17.5%, and Cedarhurst and Hewlett around 17%. A drop that size is almost never a levy cut — it's a reassessment or a jump in local values resetting the math. The lesson for a homeowner watching their own rate tick down: check whether your bill actually fell before you assume you got a break.
FAQ
Which Long Island town has the highest property taxes?
By full-value rate, Levittown in Nassau County tops the Island at about 2.67% — the steepest of the 232 communities we tracked. The rest of the top of the list is also central-Nassau South Shore: North Merrick (2.39%), Jericho (2.23%), Merrick (2.20%), North Bellmore (2.19%), and Baldwin (2.14%). By raw dollars, the heaviest bills are different — they fall on Nassau's Gold Coast, where Sands Point and Matinecock run near $47,000 a year.
Which Long Island town has the lowest property taxes?
The lowest full-value rates are all on Suffolk's East End. Sagaponack is the floor at roughly 0.02%, followed by Wainscott (0.09%), Quogue (0.13%), Bridgehampton (0.13%), and Amagansett (0.13%). These rates are low because East End towns assess property at a small fraction of its very high market value — not because the underlying homes are cheap.
How are Long Island property taxes calculated?
Your taxes equal your assessed value, minus any exemptions, times the combined tax rate of every jurisdiction you fall in — county, town, school district, and sometimes a village or special district. Because towns assess at different fractions of market value, the only fair way to compare across town lines is the full-value rate: total taxes levied divided by true market value. The school district is almost always the largest piece of the bill.
What's the difference between the full-value rate and the effective rate?
They measure the same idea — tax as a share of market value — at different points. The full-value (gross) rate used in this guide is the levy divided by market value before exemptions, straight from the state Comptroller. The effective rate you'll see on sites like Zillow or SmartAsset is typically figured after exemptions like STAR, so it comes out lower. The full-value rate is the cleaner number for ranking towns; your real bill, after exemptions, will land below it.
Why are Hamptons property tax rates so low?
Because East End towns assess property at a very small fraction of its market value, and market values out there are extraordinarily high. Divide a moderate tax levy by an enormous assessed base and the full-value rate collapses toward zero. The low rate doesn't always mean a low bill — a sub-0.15% rate on a multimillion-dollar house can still produce a five-figure tax bill — but as a percentage of value, the East End genuinely pays the lightest property-tax rates on Long Island.
How do I grieve my property assessment?
File Form RP-524 with your assessor or Board of Assessment Review by your town's Grievance Day, present comparable sales as evidence, and if the board denies you, file for Small Claims Assessment Review (for one-to-three-family homes) within 30 days of the final roll. It's free and you don't need a lawyer.
When is the property tax grievance deadline on Long Island?
It depends on your county. Suffolk towns generally hold Grievance Day on the third Tuesday in May. Nassau County runs an earlier calendar through its Assessment Review Commission, with a deadline that usually falls in late winter or early spring and is sometimes extended. Confirm your exact date with your assessor or county each year, because it shifts.
Are Long Island property taxes going up?
The full-value rate actually fell in about 80% of Long Island communities from 2024 to 2025 — but that's mostly rising home values outpacing the levy, not shrinking bills. In dollar terms, most Long Island homeowners are not paying less. Watch your own bill year over year rather than the rate, which can fall while your check grows.
Methodology and sources
We'd rather show our work than ask you to trust us, so here's exactly where every number comes from and what it does and doesn't mean.
Tax rates come from the New York State Office of the State Comptroller (OSC), "Real Property Tax Levies, Taxable Full Value and Full-Value Tax Rates," for 2025, with 2024 from the same series for the year-over-year trend. We use the full-value tax rate — total levy divided by taxable full market value, expressed as a percent — because it's the one rate that's comparable across towns that assess at different levels. It's a gross rate, calculated before STAR and other exemptions, so it sits higher than the post-exemption effective rates shown on consumer sites. OSC is the authoritative publisher of this metric; there's no second source computing the same figure, so we cite OSC openly rather than claiming any independent verification.
Home values are Zillow Home Value Index (ZHVI) medians from April–May 2026. Where we didn't have a current median for a hamlet, the dollar columns are left blank instead of estimated.
Dollar estimates are median home value times the gross full-value rate. They intentionally overstate a real bill, because they don't subtract STAR, veterans, or senior exemptions. Treat them as a way to compare communities and gauge order of magnitude — not as the amount you'll owe. Your actual bill, after exemptions, will be lower.
Definitions and process — full value, effective rate, RAR, equalization rate, STAR, the assessment cycle, and the grievance timeline — follow the New York State Department of Taxation and Finance, Office of Real Property Tax Services (ORPTS), at tax.ny.gov.
Sources:
- New York State Comptroller (OSC) — Real Property Tax Levies, Taxable Full Value and Full-Value Tax Rates, 2025 and 2024.
- Zillow Home Value Index (ZHVI), April–May 2026.
- New York State Department of Taxation and Finance / ORPTS — property tax glossary, STAR, equalization rates, and grievance procedures.
This guide is general information, not legal, tax, or financial advice. Assessment practices, exemptions, and deadlines change and vary by municipality — confirm specifics with your town assessor or county before you act.